Infrastructure Monitoring
Introduction
Infrastructure Monitoring in SigNoz supports Host and Kubernetes monitoring which provides a comprehensive interface for monitoring and analyzing host and pods performance, traces, and logs. This document outlines the key features and functionality available in the both these interface.
Features
Host List View
The main screen of the Host interface displays a list of all monitored hosts in your infrastructure along with some key metrics in a tabular format.
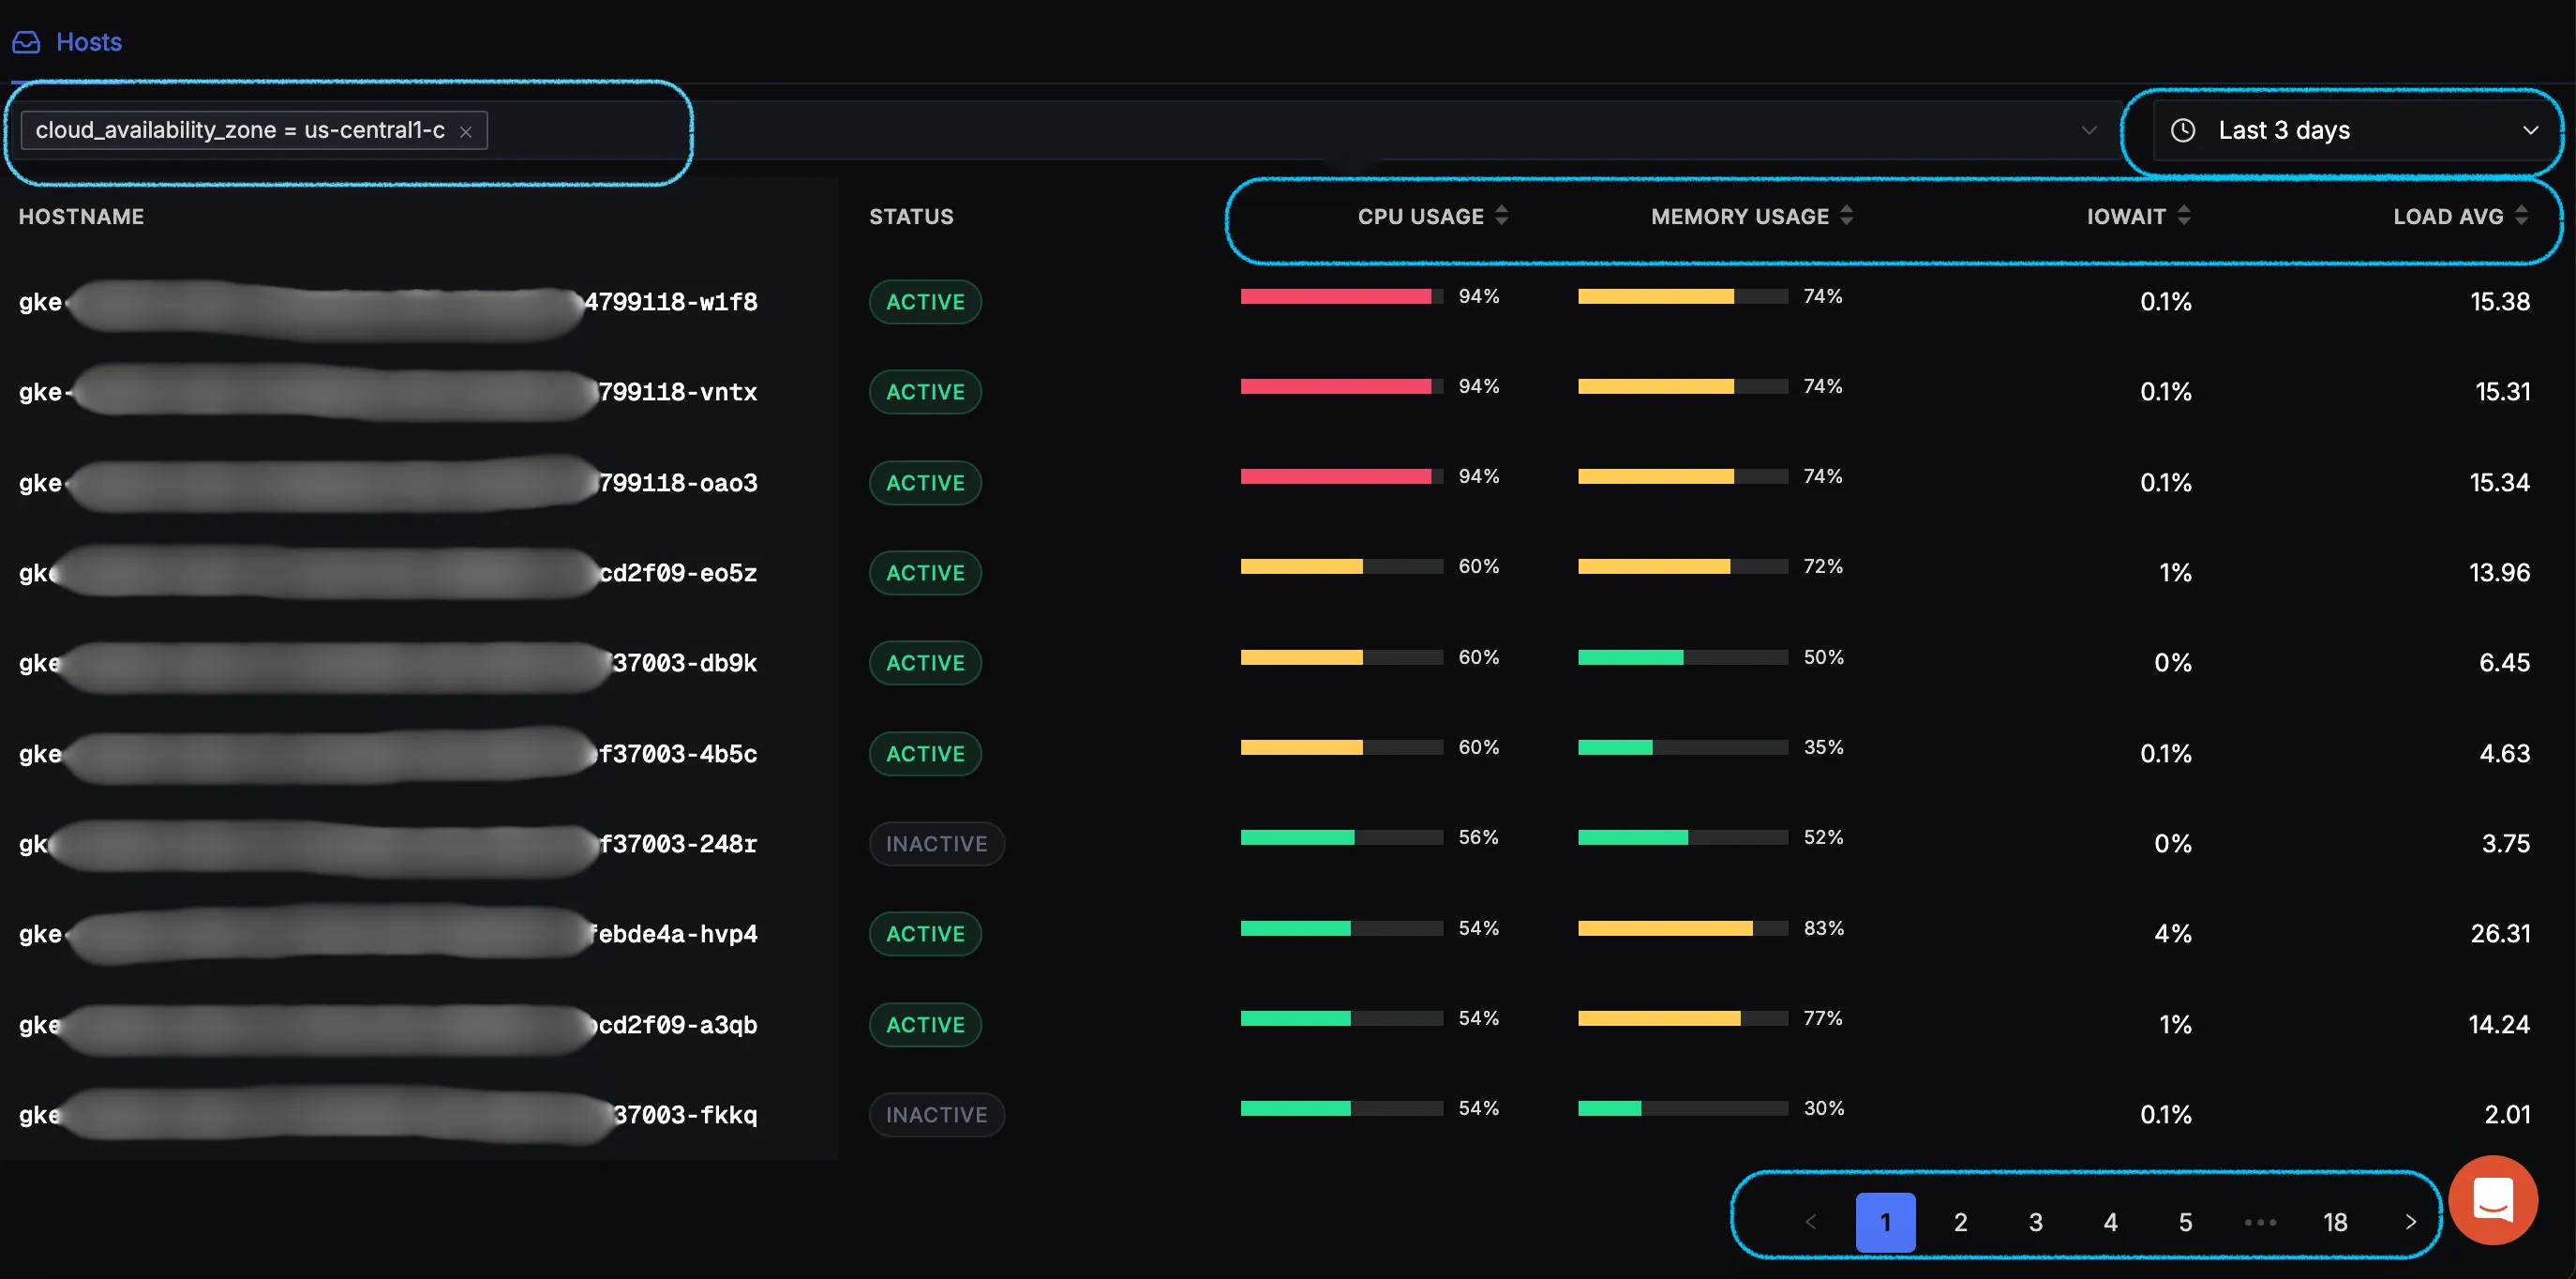
Table Columns
- Host Name: System hostname or identifier
- Status: Current operational status of the host -
ACTIVEorINACTIVE - CPU: CPU utilization percentage
- Memory: Memory usage percentage
- IOWait: Percentage of time CPU is waiting for I/O operations to complete
- Load Average: System load average value
Features:
- A search functionality to quickly locate specific hosts using different attributes
- Paginated results for efficient navigation through large host sets
- Sortable columns for easy comparison
- Real-time metric updates
Host Details
Selecting a host opens a detailed view with three main sections: Metrics, Traces, and Logs.
Metrics Tab
Monitor host performance metrics across customizable time periods.
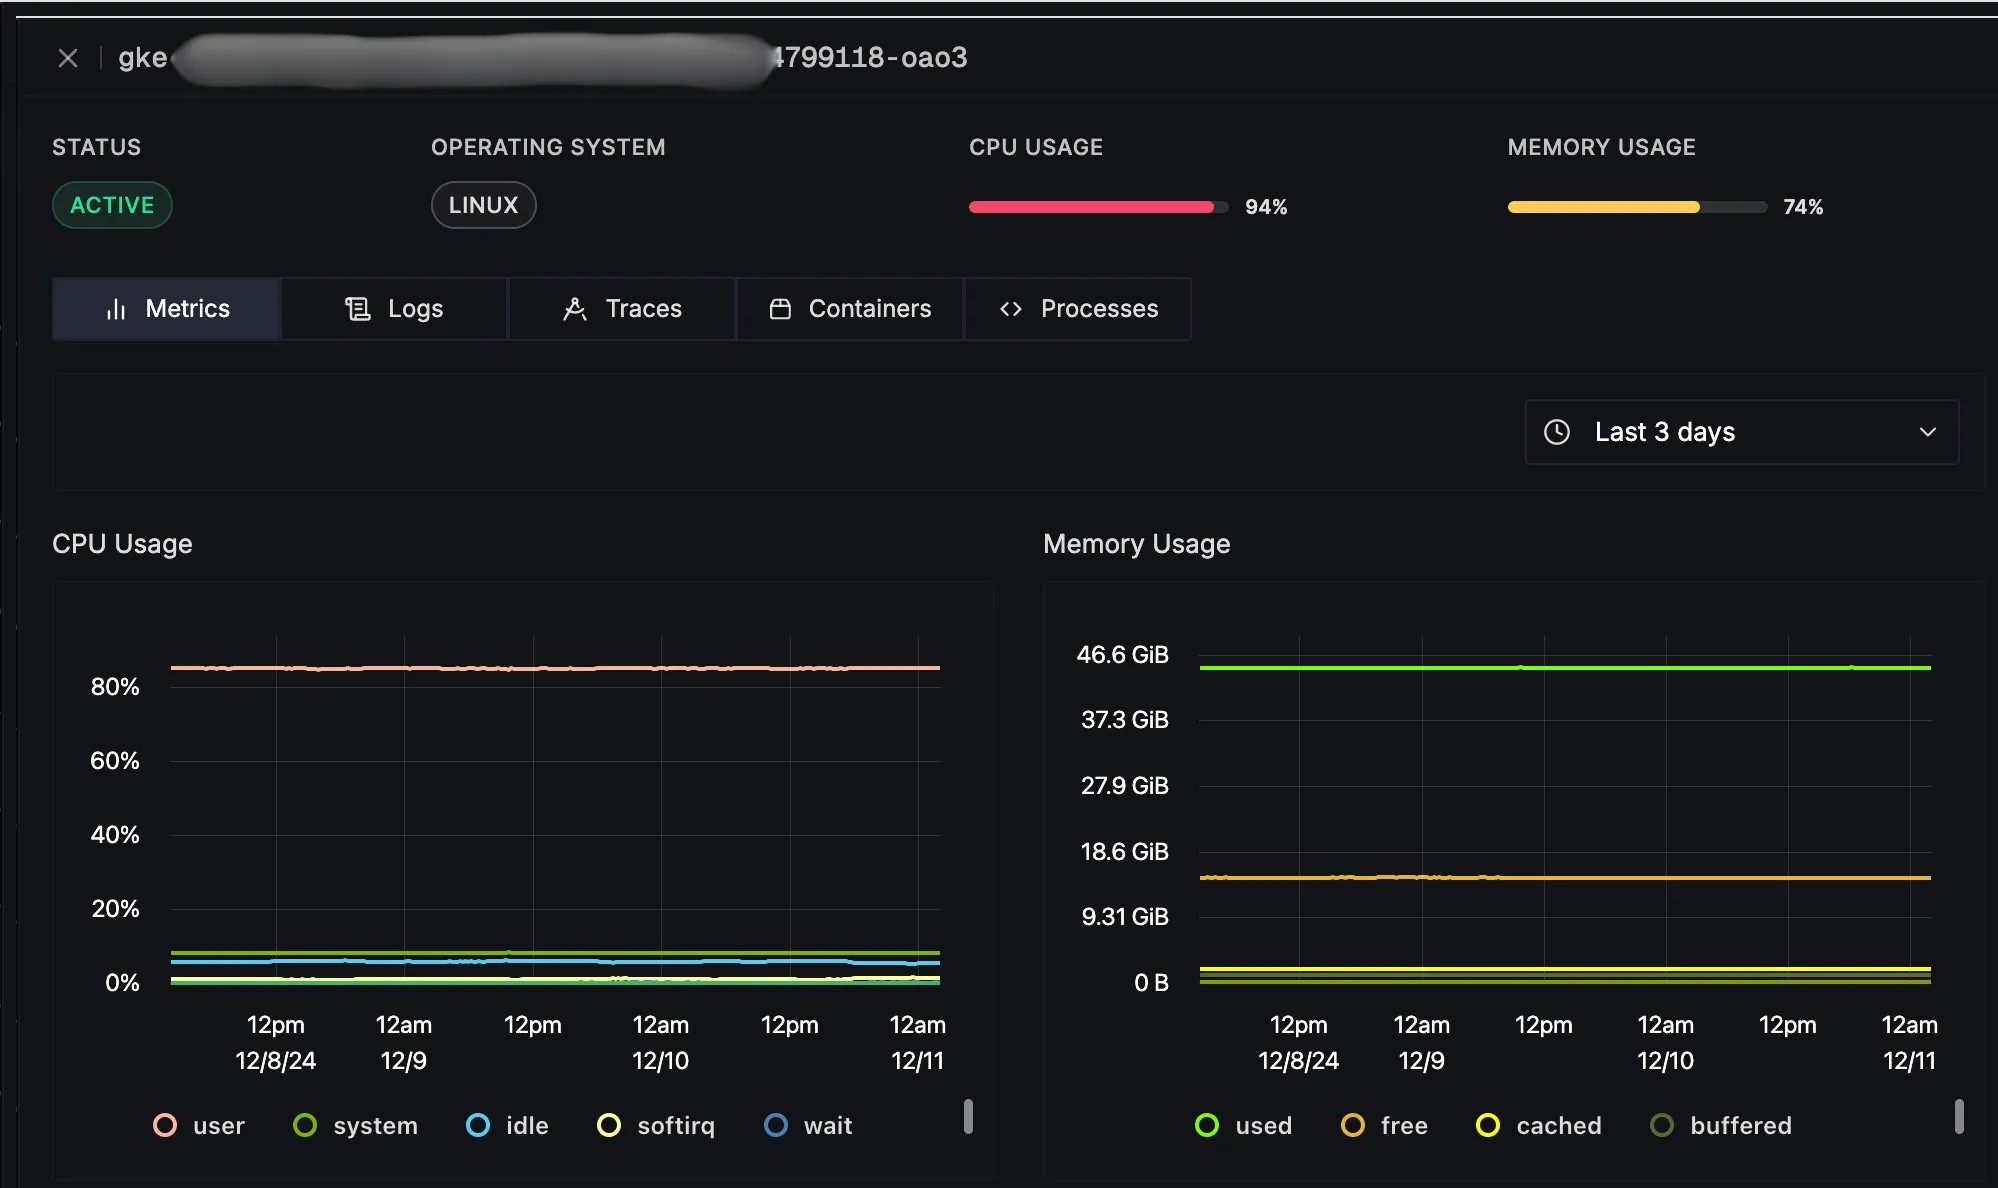
Available Metrics:
System Performance
- CPU Usage: Overall CPU utilization percentage
- Memory Usage: Physical memory consumption percentage
- System Load Average: Average system load over time
- Queue Size: Number of processes waiting for CPU time
Network Performance
- Network Usage (Bytes): Inbound and outbound network traffic in bytes
- Network Usage (Packets/s): Packet rate for network interfaces
- Network Errors: Count of network interface errors
- Network Drops: Number of dropped network packets
- Network Connections: Active network connection count
Disk Performance
- System Disk I/O (Bytes): Total bytes read/written to disk
- System Disk Operations/s: Rate of read/write operations
- Disk Operations Time: Average time taken for disk operations
Time Range Selection:
- Choose from preset time ranges (e.g., last hour, last 24 hours)
- Set custom time ranges using the date-time picker
- Change your timezone according to your preference
Traces Tab
View and analyze distributed traces associated with the selected host.
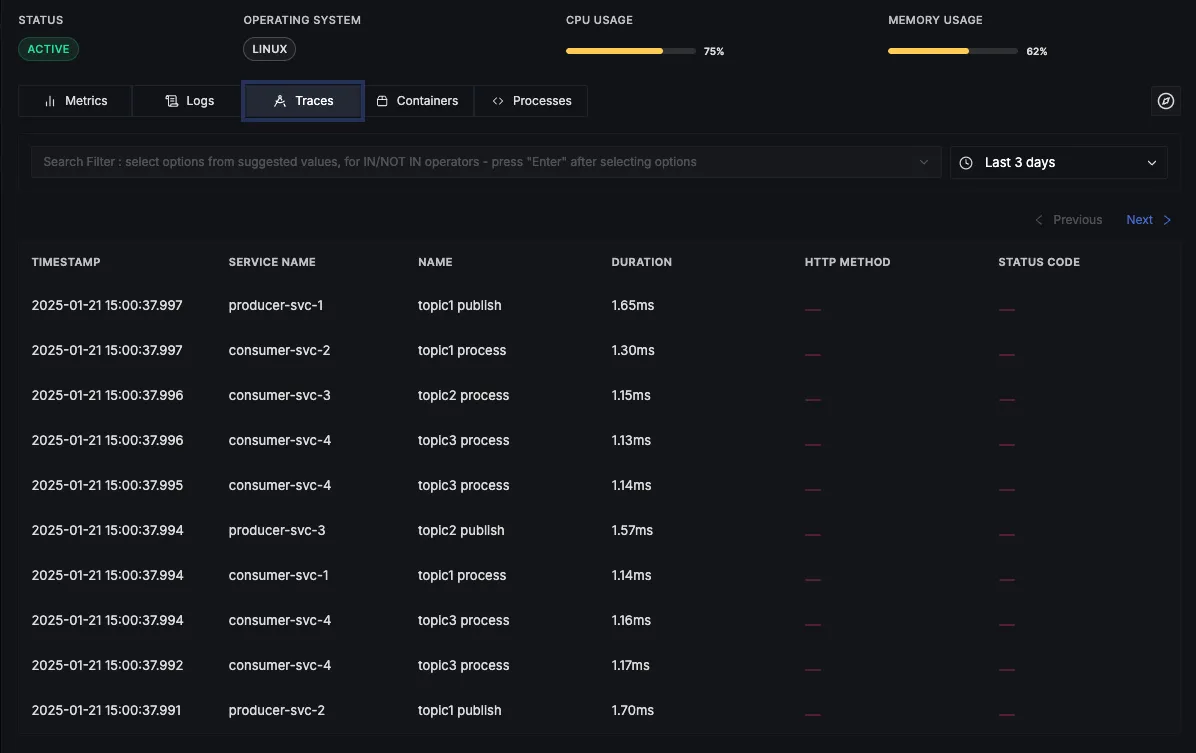
Features:
- Adjustable time range selection for trace analysis
- Advanced filtering capabilities to focus on specific trace attributes
- Direct integration with the traces explorer for deeper analysis
- The "Explore in Traces Explorer" button opens the trace in the full interface, retaining time ranges and filters
Filter Options:
- Service name: Focus on traces from specific services
- Operation type: Filter by specific operations or endpoints (e.g., GET, POST)
- Status/Error codes: Identify traces with specific success or error statuses
- Custom attributes: Refine traces using user-defined tags or metadata
Logs Tab
Access and search through host logs with powerful filtering capabilities.
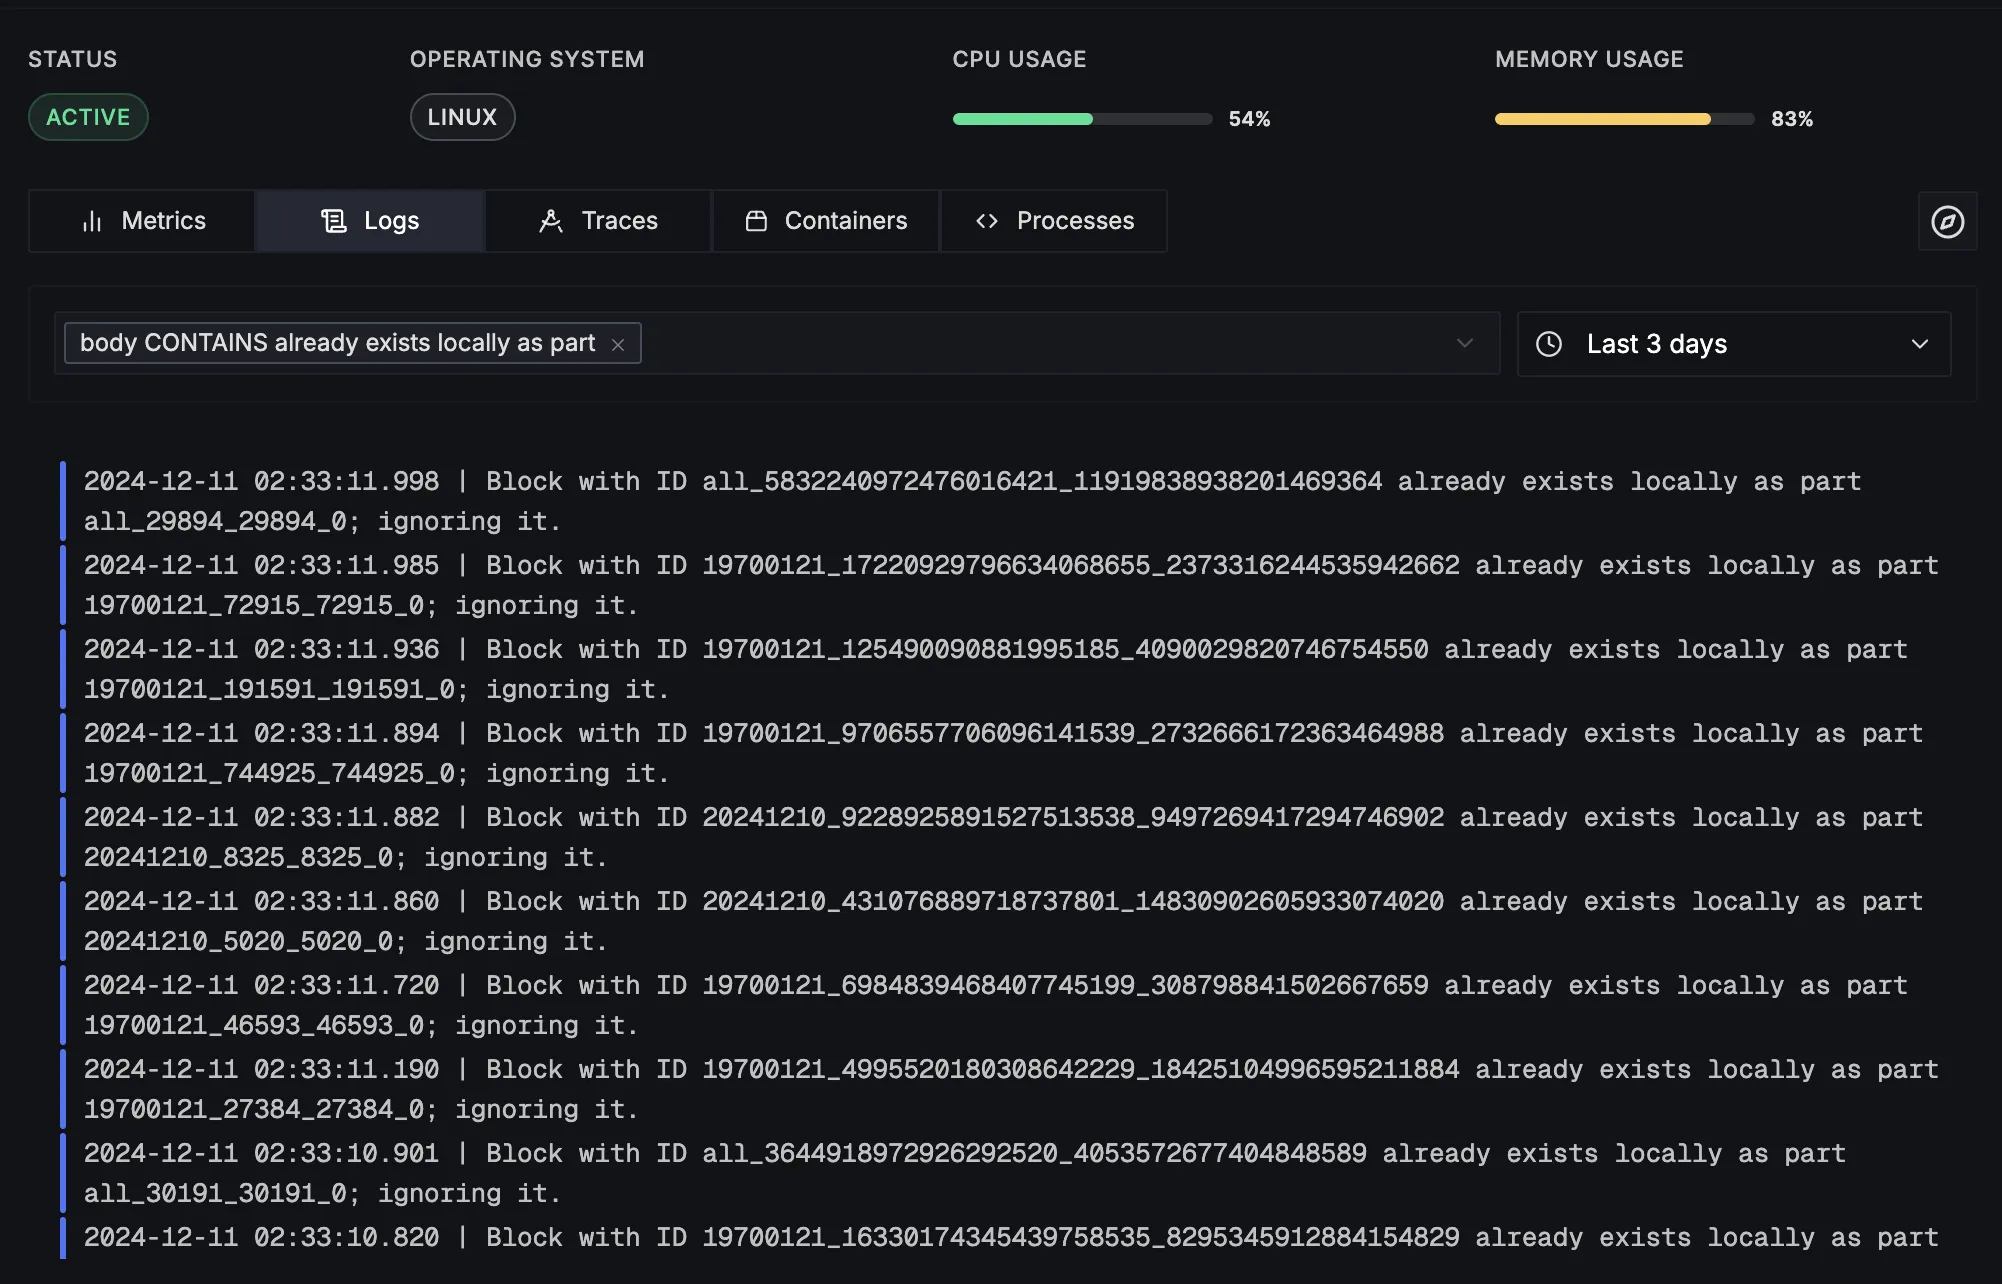
Features:
- Configurable time range selection for log analysis
- Comprehensive filtering system
- Seamless integration with the logs explorer
- The "Explore in Logs Explorer" button opens the full logs interface, keeping time ranges and filters
Filter Categories:
- Log Levels: Filter logs by severity (e.g., INFO, WARN, ERROR).
- Service Components: Focus on specific services or application components generating the logs.
- Message Content: Search for specific keywords or patterns in log messages.
- Custom Fields: Apply filters based on user-defined metadata fields for more tailored insights.
